This document, published by Karandaaz Pakistan in 2023, is available in its entirety, including all annexes, for download at the following link: https://www.karandaaz.com.pk/research/publications/financial-inclusion-index-for-pakistan
Introduction
A. Background of Financial Inclusion in Pakistan
Pakistan, a developing country with a large population, faces significant challenges in promoting financial inclusion. The majority of the population, particularly those in low-income and marginalized communities, lacks access to essential financial services. According to a the Global Findex report for 2021, 34% of the adult population in Pakistan held an account at a financial institution, this is considerably lower when compared to the global average for developing countries which is estimated to be at 71%. Zulfiqar et al (2016), found that education level, income and gender discrimination are important factors that determine financial inclusion in Pakistan. Historically, the formal financial sector in Pakistan has been unable to cater to the diverse needs of its citizens, leading to a high reliance on informal financial mechanisms. However, recent efforts by the government, regulators, and private sector have resulted in the expansion of formal financial services and innovative digital solutions, such as branchless banking and mobile wallets (SBP, 2021), aimed at bridging the gap and fostering financial inclusion in the country.
B. Importance of Financial Inclusion for Economic Growth and Development
Financial inclusion is a key driver of economic growth and development, as it enables individuals and businesses to access the financial services they need to save, invest, and protect themselves against economic shocks. A study by Demirgüç-Kunt et al. (2018) found that financial inclusion has a positive impact on economic growth, poverty reduction, and income inequality. By extending financial access to under-served segments of the population, financial inclusion fosters income generation, job creation, and poverty reduction (Bruhn & Love, 2014). Furthermore, it contributes to a more efficient and stable financial system by promoting competition, innovation, and risk diversification among financial institutions (Beck et al., 2007). In the context of Pakistan, achieving greater financial inclusion is essential for leveraging the country’s vast human and economic potential, ultimately resulting in more inclusive and sustainable growth (ILO & SBP, 2019).
C. Purpose and Objectives of the FI Index
The Financial Inclusion Index (FI Index) serves as a comprehensive tool for measuring the extent of financial inclusion in Pakistan. By evaluating access to and usage of financial services across various dimensions, the FI Index provides valuable insights into the state of financial inclusion in the country. The primary objectives of the FI Index are:
- To assess the progress made in promoting financial inclusion in Pakistan, both at the national and regional levels.
- To identify the key drivers and challenges influencing financial inclusion, thereby informing evidence-based policy decisions and interventions.
- To facilitate comparisons with previous years, as well as with other countries, enabling a better understanding of Pakistan’s performance in the context of global financial inclusion efforts.
This report presents the results of the FI Index for the year 2022, providing a comprehensive analysis of financial inclusion in Pakistan and offering policy recommendations to further enhance access to financial services for all segments of the population.
II. Methodology
This report largely follows the methodology articulated in the design document of the Financial Inclusion Index for Pakistan. However, some adjustments had to be made due to the lack of availability of supply side data. Furthermore, a new sub index was also added to the index.
A. Construction of the Pakistan Financial Inclusion Index (PFFI)
This document is in continuation to the design document of the Financial Inclusion (FI) Index. The originally planned index relied heavily on supply side data with regards to financial accounts, financial access points as well as identification of underserved markets. However, due to the unavailability of the requisite supply side data, it was decided to use the data from the Karandaaz Financial Inclusion Survey (K-FIS) which is the only source of data for this Index. In this section we will briefly describe each of the 6 sub-indexes of the FI Index. More detailed information has been included in the annexes.
Sub Index 1: Financial Accounts Registration:
This sub-index looks at the level of account registration. For this reason, three types of financial accounts were included in this measure. These are bank accounts, mobile money accounts and microfinance institution accounts. All these three accounts are covered by the K-FIS 2022, the relevant survey questions as well as the details on the construction of this sub-index are attached as Annex 1. This sub-index is one of those sub-indexes that will benefit greatly if it is calculated by the use of supply side numbers, as not only more types of financial accounts could be included, but it would also be industry estimates rather than estimates from a survey.
Sub Index 2: Financial Access Points:
This sub-index is focused on the availability and access to financial access points. The aim is to capture how much of a barrier is constituted by the distance to access to a financial access point. The K-FIS 2022 survey gives self-reported estimates of time as well as distance from various financial access points. This sub-index ranks the various regions according to the time cost of accessing various financial access points. The weighting of the index rewards quicker access to financial access points, and regions where respondents are reporting a shorter time required to get to a financial access points get a higher score. This sub-index considers the distances from banks, ATMs, mobile money agents (over the counter) and microfinance institutions. A more detailed construction of this index is attached as Annex 2. This sub-index will also benefit from supply side data as that will provide regional, per capita estimates for these types of financial access points. However, these self-reported time-costs from the respondents capture additional dimensions, such as the availability of transport and even the road infrastructure which might make the per-capita availability of financial access points different across different regions.
Sub Index 3: Under-served Markets:
This sub-index assigns a higher weight to “under-served markets”. These are markets with lower levels of financial inclusion. Due to the data limitations of K-FIS, only three variables were used to break up the K-FIS sample into segments. These variables were regions, urban/rural and gender. Using these variables a total of 28 segments were created, some examples of such segments are: Balochistan-Rural-Women, Islamabad-Urban-Men etc. For each region an estimate was created that gave the highest weight to the segment that had the lowest financial inclusion and the lowest weight for the segment with the highest financial inclusion. A more detailed construction of this sub-index is attached as Annex 3. This sub-index will also benefit greatly from supply side data, as more robust and diverse segmentation could be formed using a much more diversified set of variables than what is offered by K-FIS.
Sub Index 4: Capabilities:
This sub-index looks at three types of self-reported abilities. These are “Financial Awareness”, this covers knowledge about the functionality of bank accounts and mobile money wallet accounts. For each type of account, the respondents were asked if they were aware of the accounts performing a particular function, such as: Person 2 Person (P2P) transfers, ability to do retail shopping with the help of an account, paying utility bills etc. The second type of tested ability was that of “Financial Literacy”, where respondents were tested on their basic numeracy (addition, subtraction, division and multiplication) as well as knowledge of financial concepts (risk diversification, compounding, discounting as well as inflation). The third type of tested ability was “Digital Literacy”, this entails the ability to conduct various functions using a mobile phone, these functions included the ability to dial a number, send and receive text messages, change phone settings, download apps, use social media etc. A more detailed explanation of the construction of this sub-index is attached as Annex 4. This sub-index can not be created using supply side data and for this, demand side data is very appropriate.
Sub Index 5: Diversified Usage:
This is a new sub-index and it was not part of the initially proposed PFII. This sub-index looks at diversity of usage of financial accounts, and rewards a higher level of diversity with a higher score. Diversity here can be explained with an example; consider region A and B where the same number of respondents reported to using a mobile money wallet. However, in region A the respondents reported to using their mobile money wallets for P2P transfers, retail shopping as well as paying school fees, meanwhile, the respondents in region B reported to only use their mobile money wallets for P2P transfers. The index is designed in a such a way that in this scenario it will give a higher score to region A. More details on the construction of this sub-index are attached as Annex 5. The intuition behind this sub-index is that if a region is using more use-cases then it is likely that the use of mobile money wallets would be more widespread, as each use-case speaks to the requirements of a particular demographic. More use-cases means that more demographics are using formal financial accounts to conduct transactions that could also be conducted through cash. This is also a sub-index that will benefit greatly from supply side statistics as those would be actual transaction statistics, whereas right now the index is relying on self-reported estimates.
Sub-Index 6: Trust Levels:
This is also a new sub-index and it was not part of the initially proposed PFII. This sub-index looks at the trust levels surrounding financial institutions. These institutions include; banks (public, private and foreign mobile money services, mobile money agents, microfinance institutions. This index rewards a higher level of trust positively but at the same time penalizes for lack of trust with a negative score. More details on the construction of this sub-index are attached as Annex 6.
B. Strengths and Limitations of the Index
The following are some strengths and weaknesses of this index.
Strengths:
- Comprehensive Approach: The Index uses a variety of sub-indexes to gauge different aspects of financial inclusion, offering a comprehensive picture of financial accessibility and utilization across regions and demographics. This multi-dimensional approach enhances the utility and reliability of the index.
- Inclusion of New Sub-Indexes: The recent introduction of sub-indexes on ‘Diversified Usage’ and ‘Trust Levels’ indicates the index’s flexibility and its capacity to incorporate new relevant aspects over time. These additions allow for a more nuanced understanding of financial inclusion, extending beyond simple access to financial services.
- Use of Survey Data: Using demand-side data, such as the Karandaaz Financial Inclusion Survey (K-FIS), offers a rich, people-centered perspective on financial inclusion, capturing individual experiences, perceptions, and self-reported abilities, which cannot be gauged through supply-side data alone.
Weaknesses:
- Dependence on Survey Data: The index’s reliance on the K-FIS limits the range of available data, potentially neglecting important aspects not covered by the survey. Also, the representativeness and quality of survey data are subject to sampling design and response biases.
- Limited Use of Supply-side Data: While the use of survey data has its strengths, the limited integration of supply-side data might result in an incomplete picture of financial inclusion. Supply-side data could offer crucial insights into the actual availability and spread of financial services across different regions.
- Lack of Granular Demographic Representation: If the survey data is not representative at more granular demographic levels, the index might overlook disparities within broader demographic groups. The index’s effectiveness in informing targeted interventions could be hampered by this lack of detail.
- Self-reported Metrics: Certain sub-indexes like ‘Capabilities’ rely on self-reported abilities, which may not always accurately reflect actual skills and could be influenced by the respondent’s perception or understanding of the question.
III. Overall Results
A. Pakistan Financial Inclusion Index:
Before going into the breakup of the various sub-indexes, we look at the overall results, these are listed in Figure 1 below.

The results of the Financial Inclusion Index provide a comprehensive view of the state of financial inclusion across various regions in Pakistan. The overall scores range from 0.54 to 0.93, showing a substantial variation in financial inclusion across different regions.
The highest performing region is Islamabad, with an overall score of 0.93 out of a perfect score of 1.0. This region’s impressive performance can be largely attributed to its top-ranking scores in all the sub-indexes, achieving a perfect score of 1.00 in three out of six sub-indexes, namely Financial Accounts, Access Points, and Capabilities. This suggests a well-rounded financial environment, with a relatively developed infrastructure along with high levels of awareness and capabilities.
Azad Jammu and Kashmir stands out as the second-best performer with an overall score of 0.88. While its individual sub-index scores are generally high, the region particularly shines in the Trust sub-index. This implies a relatively high level of trust in formal financial institutions, which is a critical factor contributing to financial inclusion.
Gilgit-Baltistan also exhibits strong performance, with an overall score of 0.83. Notably, it received the highest score in the “Diversity of Usage” sub-index, suggesting that mobile money and bank account holders in this region use a more varied basket of financial services, when compared to other regions.
Punjab, Sindh, and Khyber Pakhtunkhwa are in the middle with very close overall scores of 0.80, 0.78, and 0.78, respectively. While these regions have relatively high scores in the Access Points, Capabilities, and Diversity of Usage sub-indexes, but their scores in the Financial Accounts and Trust sub-indexes are relatively lower.
Lastly, the region of Balochistan, unfortunately, lags with an overall score of 0.54, well below the country average. The region shows particularly low scores in the Financial Accounts sub-index (0.31) and the Trust sub-index (0.29), suggesting challenges in access to and trust in formal financial services.
As discussed earlier, the sub-index scores are derived from raw scores for each sub index, Table 1 below shows the raw scores for each region along with the Coefficient of Variation for each sub-index.
Table 1: Raw Scores by Region and Sub-Index

The raw scores provide deeper insight into the performance of each region across the six sub-indexes of the Financial Inclusion Index.
In the Financial Accounts sub-index, we see that Islamabad leads with a raw score of 0.45. Azad Jammu and Kashmir and Gilgit Baltistan closely follow this, scoring 0.34 and 0.35 respectively. Punjab and Sindh perform similarly, both scoring just above the country average, with raw scores of 0.32 and 0.29, respectively. The region of Balochistan, however, struggles with a raw score of 0.14, highlighting a dearth of registered financial accounts in the region.
The Access Points sub-index shows Islamabad leading with a raw score of 0.46. Gilgit Baltistan and Azad Jammu and Kashmir closely follow with scores of 0.42 and 0.43, respectively. Here, Balochistan falls below the country average with a score of 0.25, pointing towards a more drastic lack of financial service access points, in comparison to other parts of the country.
The Underserved Markets sub-index shows fairly similar performances across the board, with Islamabad showing the highest raw score of 0.29 and Balochistan showing the lowest of 0.17. This implies that the under-served markets are served much better in Islamabad, when compared to Balochistan.
Capabilities sub-index, which assessed financial awareness, financial literacy and digital literacy shows the highest raw scores among the six sub-indexes. On this measure, once again Islamabad stands out with a score of 0.60, followed closely by Azad Jammu and Kashmir with a score of 0.55. Even Balochistan, which trailed in the first two sub-indexes, performs relatively better here with a raw score of 0.41.
On the “Diversity of Usage” sub-index, all regions present similar scores around 0.20, with Gilgit Baltistan scoring slightly higher at 0.22. This suggests a similar level of diverse usage of financial services across all regions. Similarly, it is important to consider that this score of 0.2 is out of a perfect score of 1.0, thus implying that usage of formal financial services is limited to a smaller number of use cases.
Finally, the Trust sub-index, which measured the level of trust in formal financial institutions, shows the most variation in scores, with Azad Jammu and Kashmir leading with a score of 0.47, while Balochistan lags with a score of 0.13. This indicates varying levels of trust in formal financial institutions across the regions. This also flags regions that might be in need of more confidence and trust building campaigns.
An analysis of the coefficients of variation (CV) among the raw scores further emphasizes the disparity across various dimensions of financial inclusion in the country. The CV, a statistical measure of relative variability, indicates the level of dispersion around the mean.
The highest coefficient of variation is observed in the Trust sub-index (28%) and the Financial Accounts sub-index (27%), indicating substantial variability among regions in these two dimensions. This suggests that trust in financial institutions and the prevalence of financial accounts vary greatly across different regions of Pakistan, emphasizing a need for region-specific strategies to boost trust and increase the number of accounts.
The Access Points and Underserved Markets sub-indexes, with CVs of 15% and 16% respectively, also show a considerable amount of variation. This suggests disparities in the availability of financial services and the extent to which traditionally underserved markets are being reached.
In contrast, the lowest coefficients of variation are found in the Capabilities and Diversity of Usage sub-indexes, with CVs of 10% and 7% respectively. This suggests a more uniform level of financial literacy and utilization of financial services across the regions. Although this uniformity is at a very low level, thus implying need for improvements in both these areas.
In conclusion, while there is cause for optimism in the progress made towards financial inclusion in Pakistan, the disparity across regions and sub-indexes highlights the need for more tailored, region-specific interventions. Leveraging the strengths of each region and addressing the identified gaps can lead to comprehensive and inclusive financial growth for the entire country. The Financial Inclusion Index, with its blend of overall and raw scores, offers a powerful tool to guide these efforts. The conclusions from this index can be further augmented with the use of supply side numbers for some of the sub-indexes, as highlighted in the methodology section.
We now look at each of the sub-indexes in more detail.
B. Sub-Index 1 – Financial Accounts Registration:
The Financial Accounts Registration sub index looks at the number of unique[2] financial account registration. The types of financial accounts considered are bank accounts, mobile money wallets and fully serviced microfinance institution accounts. As explained earlier, the scores range from “0”, which is the lowest possible score and represents a situation where there are no financial accounts, to 1 which represents the highest score among the seven regions that are being compared. As Figure 2 below shows, Islamabad achieving the highest score of 1.00, followed by Gilgit Baltistan at 0.78 and Azad Jammu and Kashmir at 0.76. Balochistan lags significantly behind with a score of 0.31, suggesting the lowest level of financial account ownership among the regions.

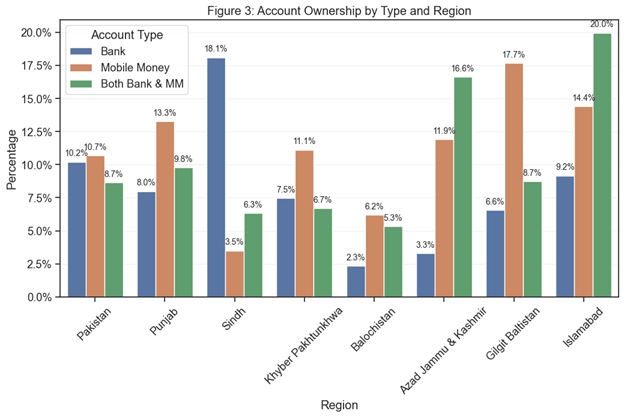
Bank accounts and Mobile Money wallet accounts were the two major types of accounts that were held across the regions, however, there are some interesting variations among regions in account ownership in these categories. Figure 3 below shows these variations; bank accounts are the most popular form of financial account ownership in Sindh, followed by Punjab and Islamabad. Meanwhile, mobile money accounts are most popular in Gilgit Baltistan, Azad Jammu and Kashmir, and Khyber Pakhtunkhwa. A combination of both these types of accounts was the highest in Islamabad, followed by Azad Jammu and Kashmir and then Punjab.
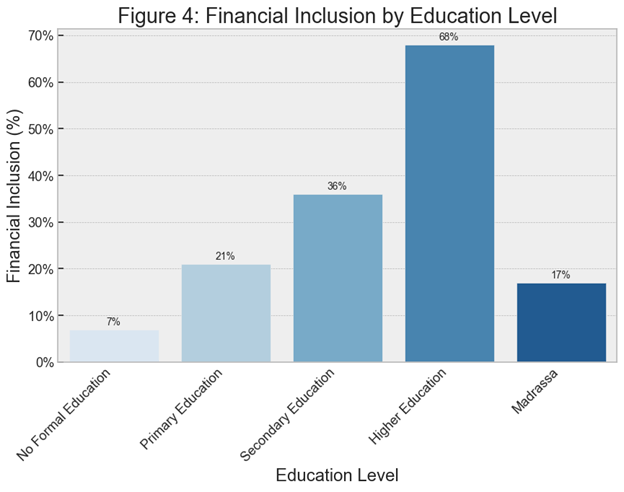
In overall terms, education seems to be an important factor in the choosing to opt for a formal financial account. As shown in Figure 4 below, financial inclusion rates are significantly higher for those with higher education (68%), compared to those with no formal education (7%). This highlights the importance of education in driving financial inclusion. Ensuring access to quality education, particularly in underserved regions, can be an important factor in improving financial inclusion rates.
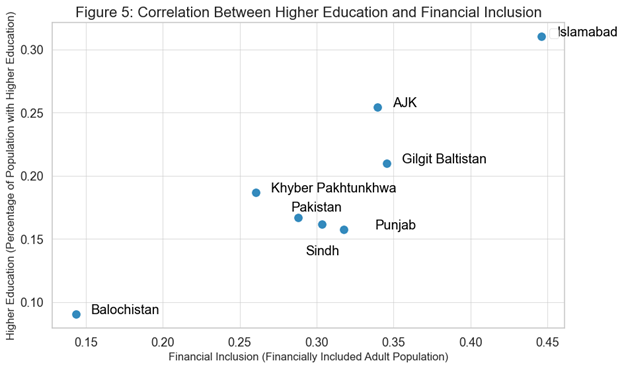
The level of education seems to be closely correlated to the level of financial inclusion, as shown in Figure 5 below. Regions with higher proportions of individuals with higher education, such as Islamabad, Gilgit Baltistan, and Azad Jammu and Kashmir, tend to have higher financial inclusion rates. This further indicates the need for investments in education to boost financial inclusion in the long run.
The financial inclusion of women is another very important factor towards the determination of overall financial inclusion levels. As figure 6 shows the financial inclusion of women is lower than men when compared across all regions. In absolute terms, Islamabad has the highest gender gap (46%), with a significantly higher percentage of men (62%) having financial inclusion compared to women (16.5%). Despite this, it’s also important to note that Islamabad has the highest level of female account ownership among all regions. This demonstrates the complex nature of gender disparities and underscores the importance of considering context when interpreting these numbers.
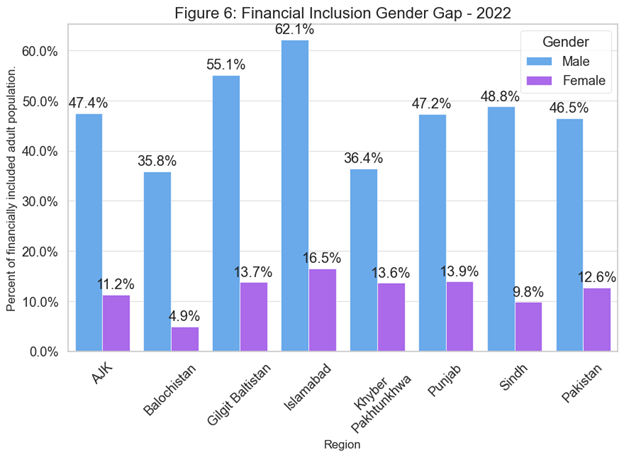
While a simple absolute measure[3] might flag Islamabad as having the largest gender gap, a relative[4] measure presents a different picture. This is where Balochistan stands out. Even though the absolute gender gap is not the largest in Balochistan, the relative disparity between men and women is indeed highest in this region. This is due to the fact that despite a lower percentage of men being financially included compared to other regions, the percentage of women with financial inclusion in Balochistan is even lower.
In conclusion, the analysis of Sub Index 1: Financial Accounts Registration highlights the importance of considering regional disparities, education levels, and gender gaps when interpreting the levels of regional financial inclusion.
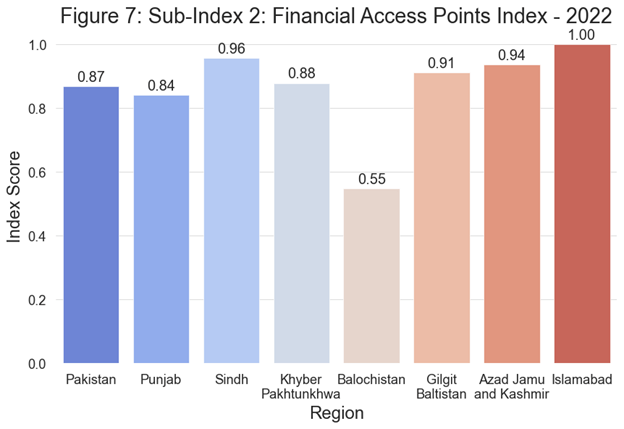
C. Sub-Index 2 – Financial Access Points:
The Financial Access Points Index is based on self-reported distances from four types of financial access points: bank branches, ATMs, mobile money agents (over the counter), and branches of microfinance institutions.
Figure 7 presents the scores of the Financial Access Points Index across the eight regions. The scores range between 0 and 1, with 1 indicating the highest level of financial access. Islamabad stands out with the highest score, suggesting that it has the most readily accessible financial services amongst the regions. Conversely, Balochistan has the lowest score, indicating more challenging circumstances in accessing financial services. Interestingly, Sindh and Azad Jammu & Kashmir outperform Punjab, despite Punjab being more populous. This could be due to various factors, including a more evenly distributed network of financial access points in these regions.
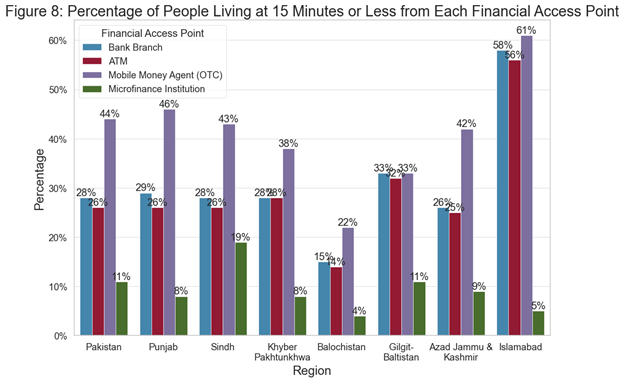
The availability of these various types of access points varies by region, as shown in Figure 8 below. Mobile money agents, offering Over-the-Counter (OTC) services, stand out when compared to other types of financial access points, across all regions as a significant proportion of the population lives within 15 minutes of a mobile money agent, underlining the widespread availability of these services. Islamabad again stands out with 61% of its population being in close proximity to a mobile money agent. Sindh, Punjab, and even Khyber Pakhtunkhwa also show robust access, with more than a third of their population residing within a short distance of a mobile money agent.
However, Balochistan starkly contrasts with all other regions. Despite the potential of mobile money agents to bridge the financial inclusion gap, only 22% of Balochistan’s population lives within 15 minutes of a mobile money agent. This points to a substantial deficiency in the reach of these crucial financial services within the region.
The proximity of financial access points also seems to be a reflection of the level of development in a region. To capture the development levels of these regions, we used the Human Development Index (HDI) estimates from 2015[5]. As Figure 9 below shows there seems to be a positive correlation between the Financial Access Points Index and the Human Development Index (HDI) across various regions of Pakistan.
However, several noteworthy outliers and unique cases emerge. Islamabad stands out with the highest scores in both the Financial Access Points Index and HDI, underlining its position as the most advanced and accessible region. On the other end of the spectrum, Balochistan’s low score in both indices highlights the considerable development and financial access challenges it faces.
Intriguingly, Sindh, despite having a relatively low HDI, boasts a high Financial Access Points Index. This could suggest that while financial services are relatively accessible in the region, other crucial components of human development (such as health and education) might be lagging. Conversely, Azad Jammu and Kashmir score high on HDI but has a lower Financial Access Points Index, implying that despite less financial access, it has managed to achieve a higher level of human development, possibly due to better performance in non-financial aspects of the HDI.

In conclusion, while financial access generally corresponds to human development, regional nuances and variations indicate that other factors also play significant roles in shaping human development outcomes.
The disparities in the Financial Access Points Index mirror the varied stages of economic development across the regions. Islamabad, with the highest level of economic development as measured by HDI, also leads in terms of access to financial services. Conversely, Balochistan, which lags in terms of HDI, shows the least access to financial services. However, regions like Sindh and Azad Jammu and Kashmir highlight that the relationship between economic development and financial access might not always be linear, suggesting the influence of other regional factors.
The access to mobile money agents stands out as a critical aspect in financial inclusion. The pervasive availability of these agents across most regions underlines their potential role in bridging the financial inclusion gap. However, regions like Balochistan lag considerably in this regard as well, indicating a need for targeted interventions.
D. Sub-Index 3 – Under-served Markets:
The Under-served Markets Index is the third sub-index of the Financial Inclusion Index. This sub-index specifically measures the degree to which traditionally under-served segments of society are receiving financial services. A higher score in this index indicates a greater level of service provision for the under-served markets.
Figure 10 below presents the scores for the Under-served Markets Index across the eight regions. The scores range between 0 and 1, with 1 indicating the highest level of service provision for the under-served markets. Here, Islamabad stands out with a score of 1, suggesting that, a higher level of service for its under-served markets compared to the other regions. Conversely, Balochistan, has the lowest score pointing to a gap in financial service provision to its under-served markets. Apart from Balochistan, the province of Sindh is also below the national average.

The top ten under-served segments across the country are shown in Table 1 below. Remarkably, all ten segments are female populations from different regions, underscoring the gender disparity in financial inclusion. In particular, the rural and urban female populations of Balochistan are the most under-served, aligning with the region’s low index score. Even in Islamabad, which scores highest on the Under-served Markets Index, the urban female population features in the top ten under-served segments, highlighting the persistent gender gap in financial inclusion.
Table 2: Top 10 most under-served markets in Pakistan

In conclusion, the Under-served Markets Index brings into focus the disparities in financial service provision to the traditionally under-served segments across different regions. Despite the challenges, the under-served markets also represent significant opportunities for expanding financial inclusion. The findings underscore the need for region-specific strategies to better serve these markets and reduce disparities, particularly along gender lines.
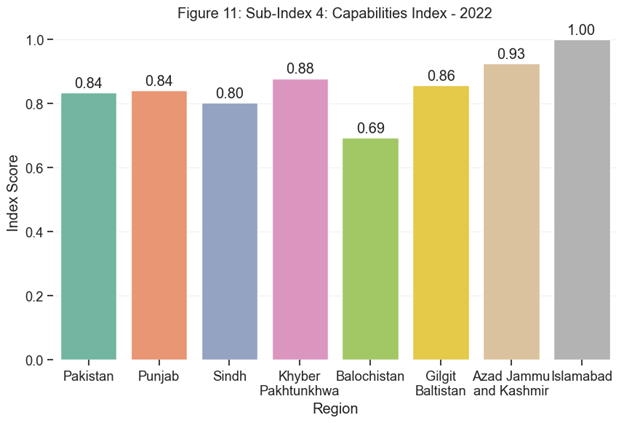
E. Sub-Index 4 – Capabilities:
The Capabilities Sub-Index represents an important part of the Financial Inclusion Index, with emphasis on financial awareness, financial literacy, and digital literacy. This sub-index offers key insights into understanding the level of engagement of individuals with the financial system.
Overall, Islamabad achieves the highest score on the Capabilities Sub-Index, as demonstrated in Figure 11, reinforcing its position as the region with the highest levels of financial and digital proficiency. Azad Jammu and Kashmir is not far behind, scoring second highest on the index. Conversely, Balochistan lags behind other regions with a score of 0.69, indicating significant challenges in these areas.
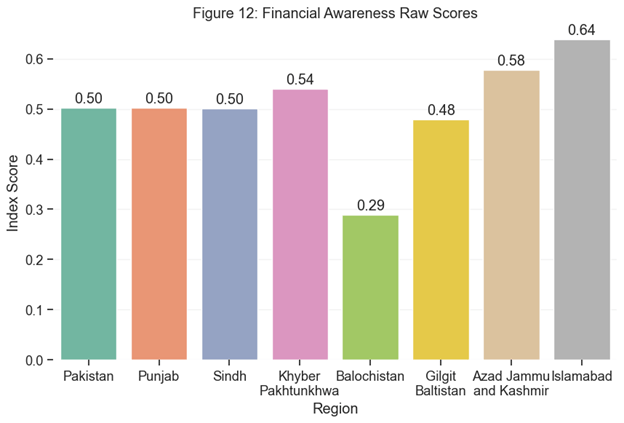
Delving deeper, the first component of the sub-index, the Financial Awareness Index, surveys individuals’ knowledge about various functions possible through mobile money wallets and bank accounts, such as saving, borrowing, peer-to-peer transfers, and retail payments. As illustrated in Figure 12, Khyber Pakhtunkhwa and Islamabad show the highest raw scores of 0.54 and 0.64 respectively, indicating a greater awareness about these financial services. Balochistan, with a significantly lower score of 0.29, demonstrates the lowest level of financial awareness among the regions.
The second component, the Financial Literacy Index, assesses individuals’ comprehension of essential financial concepts such as addition, subtraction, division, risk diversification, compounding, discounting, and inflation. According to the results in Figure 13, Khyber Pakhtunkhwa and Gilgit Baltistan excel in financial literacy, with scores of 0.57 and 0.57 respectively. Interestingly, Balochistan achieves a similar score to the national average, suggesting an understanding of basic financial concepts, despite lower financial awareness.

The third and final component, the Digital Literacy Index, evaluates self-reported proficiency in operating a mobile phone, including activities like dialing phone numbers, sending and receiving SMS messages, downloading, and using apps. As shown in Figure 14, Islamabad, once again, leads with a score of 0.58, followed by Azad Jammu and Kashmir and Gilgit Baltistan, both with a score of approximately 0.54.

In summary, the Capabilities Sub-Index reveals a significant disparity in financial and digital capabilities across regions, suggesting the need for targeted interventions to enhance financial inclusion, especially in regions like Balochistan that are currently lagging behind. It is also crucial to note the importance of digital literacy in this regard, given the increasing relevance of digital financial services.
F. Sub-Index 5 – Usage Diversity:
The Usage Diversity Sub-Index of the Financial Inclusion Index provides valuable insights into the diverse utilization of financial services among mobile money and bank account holders. This sub-index rewards more diverse usage, i.e., the utilization of a broader range of services such as paying utility bills, school fees, savings, peer-to-peer transfers, etc. Overall, Gilgit Baltistan leads the regions with a perfect score of 1.00, demonstrating the highest diversity in financial service usage.
At the other end of the spectrum, Islamabad, surprisingly, reports the lowest score on the index at 0.81. It appears that even though the region leads in capabilities as identified earlier, it falls behind in leveraging these capabilities for diverse financial service usage. As shown in Figure 15 below

This sub-index is composed of two components, focusing separately on the usage diversification of bank accounts and mobile money accounts.
The first component pertains to bank account usage diversity, with Sindh leading the scores at 0.19, slightly above the national average of 0.17. This indicates that bank account holders in Sindh are more likely to use a diverse array of services. Despite having the highest overall Usage Diversity Index score, Gilgit Baltistan ranks only fifth in terms of bank usage diversification.
The second component, the usage diversification of mobile money accounts, paints a slightly different picture. Here, Gilgit Baltistan tops the list with a score of 0.24, followed closely by Punjab at 0.23. Interestingly, Balochistan, which has generally lagged in other areas, demonstrates a competitive mobile money diversification score of 0.23, which is above the national average. Islamabad and Azad Jammu and Kashmir report the lowest mobile money usage diversification scores, at approximately 0.20.
These findings underscore the importance of considering usage diversity separately for different types of financial services. Although certain regions may display proficiency in using one type of service, such as bank accounts or mobile money, they may not necessarily demonstrate the same proficiency across all services. Encouragingly, the data also shows that even regions that lag in some aspects of financial inclusion, such as Balochistan, can still exhibit competitive performance in specific areas, highlighting the potential for targeted improvement strategies.
G. Sub-Index 6 – Trust:
The Trust Sub-Index represents a crucial component of the Financial Inclusion Index, gauging the level of trust that individuals place in formal financial institutions. These institutions include state-owned and foreign banks, mobile money service providers, mobile money agents, microfinance banks and institutions, and the Pakistan Post. A high score on this sub-index denotes a high level of trust in these institutions, which is critical for achieving financial inclusion as trust is a fundamental element in establishing and maintaining financial relationships.
The results presented in Figure 17 reveal a diverse spectrum of trust levels across the different regions of Pakistan.

At the top of the Trust Sub-Index, we find Azad Jammu and Kashmir scoring the highest score among the regions. This is followed by Khyber Pakhtunkhwa and Sindh, with scores of 0.71 and 0.70 respectively, suggesting that these regions also have relatively high trust levels.
Islamabad, despite leading in several other sub-indices, demonstrates a somewhat lower level of trust with a score of 0.76. Punjab and Pakistan overall both exhibit moderate trust levels with scores of 0.65 and 0.66 respectively.
Most strikingly, however, is Balochistan, which reports the lowest level of trust with a score of just 0.29, significantly lower than any other region. This suggests a notable trust deficit in formal financial institutions in Balochistan.
This Trust Sub-Index highlights an essential aspect of financial inclusion. The overall levels of trust, while varying across regions, indicate that concerted efforts are required to bolster public confidence in financial institutions, particularly in regions such as Balochistan. This could involve measures to improve transparency, customer service, and accountability in these institutions. Without such efforts, achieving the goal of comprehensive financial inclusion will be challenging.
[1] The Coefficient of Variation (CV) is a statistical measure that shows the extent of variability in relation to the mean of a population or sample.
[2] The word “unique” here means that in a situation where a person has multiple types of financial accounts (Bank account, Mobile Money wallet, or a Microfinance Institution account), that person will only be counted as once, so as to avoid any double counting.
[3] In absolute terms the gender gap is defined as the difference between male and female financial inclusion levels.
[4] In relative terms, the difference between male and female financial inclusion is divided by the sum of male and female financial inclusion estimates.
[5] https://hdr.undp.org/system/files/documents/pk-nhdrpdf.pdf

Leave a comment